Updated 11/14/13:
BTA may be squirming a bit on their infographic, but the advocacy continues – they’re holding an Advocacy 101 training on November 19 (5:30pm), pizza by Old Town Pizza.
Updated 11/13/13:
BTA has updated the graphic with revised numbers. You can see the new graphic and the explanation of the changes at their site.
Original Post 11/12/13:
Portland has the highest bicycle commute mode share in the country, so you might think that the entire populace must embrace our progressive posture on all things cycling.
Not quite.
Here and around the country members of our communities don’t always share our understanding of the benefits of cycling, which extend even to those who don’t get on a bicycle. Locally, Steve Novick, our newest City Commissioner, likes to talk about how people who bike lower health insurance costs for all of us.
Nationally, the Green Lane Project is trying to get smarter on how to talk about cycling. An example: “cycle track” doesn’t resonate with most people. But “protected bike lane” has more positive associations.
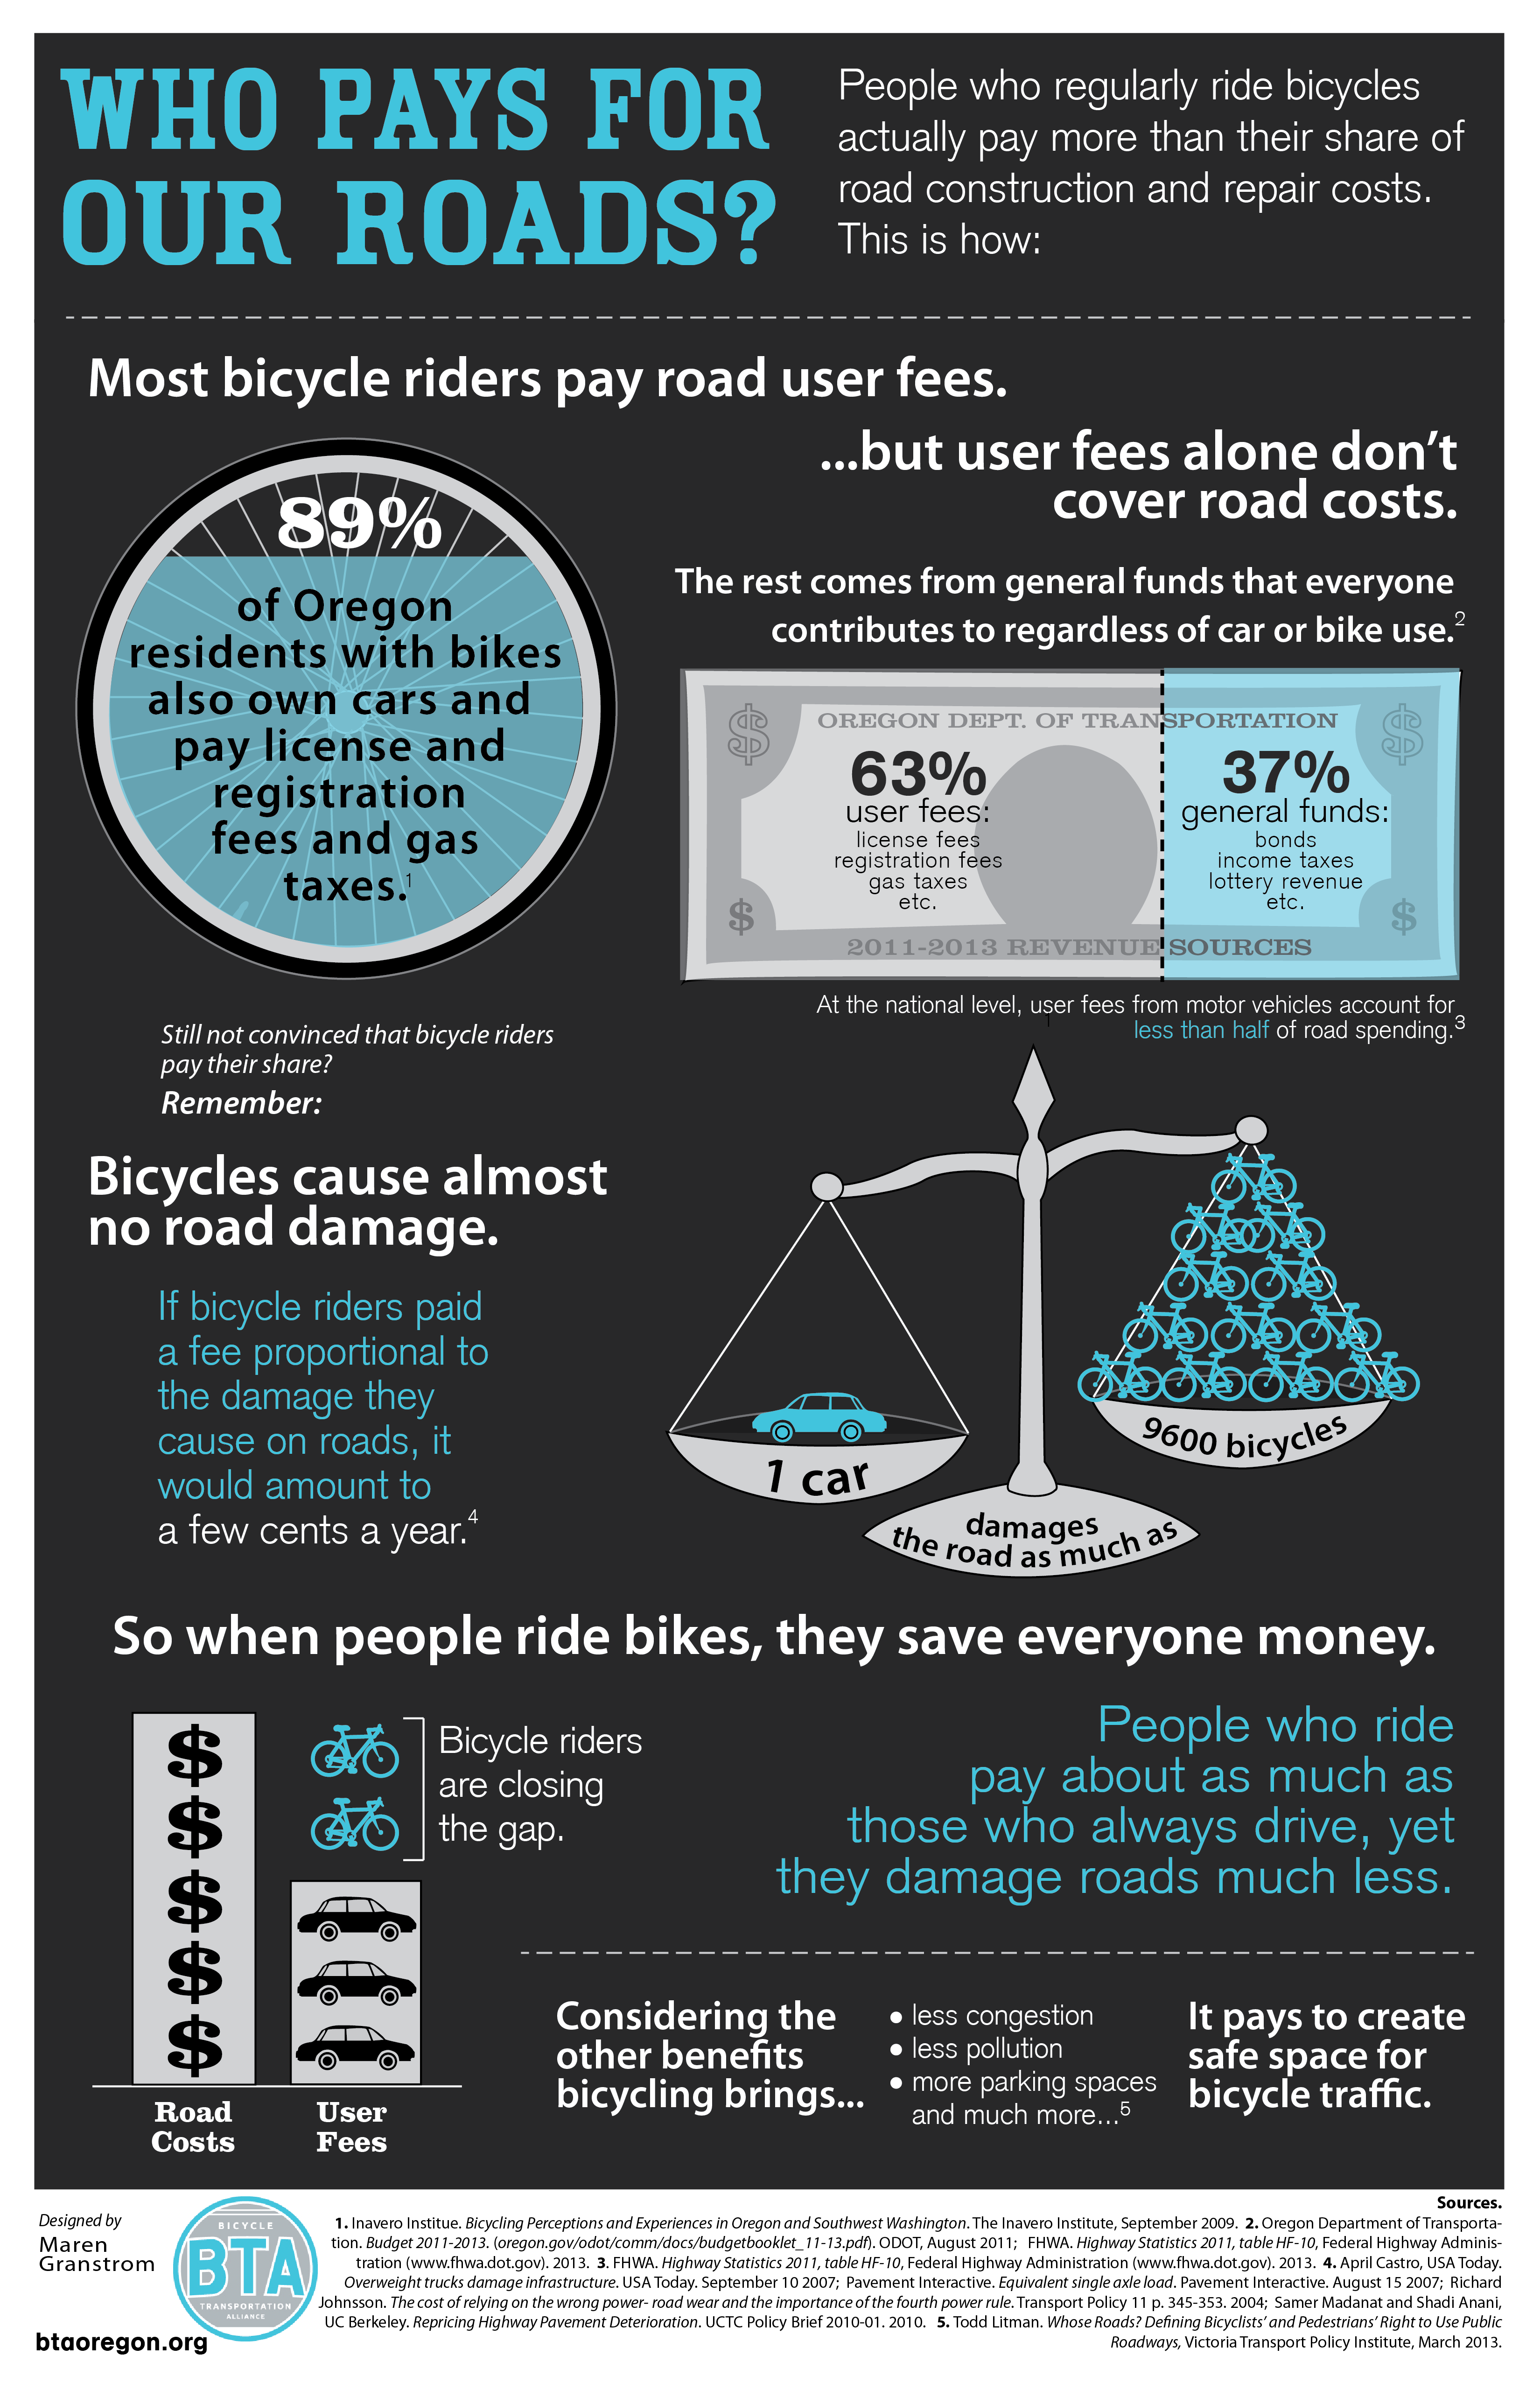
Back on the local level, the Bicycle Transportation Alliance has taken on the debunking of an old canard, that cyclists freeload on our streets and roads. The infographic below that BTA released today makes the case plain that those of us who bike are more than paying our share.
I’m looking forward to continuing to up our game and make our case!
11 responses to “Updated Again: Sharpening Our Game on Bicycle Advocacy”
The flip side of the “road damage” argument is that large vehicles–including busses–do the most damage to the roads. Transit busses (and school busses) are among the worst offenders, being heavy vehicles with only a pair of axles to distribute their weight across–it’s axle load and not gross weight that matters.
Trucks, and even long-distance motor coaches, have additional axles and thus a smaller axle load.
There are ways to mitigate this damage, of course. Use of concrete bus pads at bus stops is a big one–most of the damage occurs when a bus comes to a stop, and more of its weight is shifted to the front axle; concrete is a more durable surface than asphalt. And if other ROW improvements were made so the bus has to stop less–particularly when it ISN’T loading or unloading passengers…
This is one of the often-overlooked factors in the BRT vs. LRT debate. Busses externalize their ROW costs when they are routed in mixed traffic. You should check out the asphalt in the westbound lane of NE Glisan in front of Providence Portland. There is a roughly 2″ tall wave spike right next to the bus stop. Not sure how long it took to develop, but it is nasty.
I wish BTA would stress (more) the “one less car” argument, how every person who rides a bike leaves more infrastructure available for those who choose to drive. They do touch on that a little, but I think they need to talk about it more. The poll on the Oregonian web site had “cyclists make my commute harder” choice winning when I looked at it earlier today. What would really make commuting harder in Portland is if all of the cyclists & transit riders decided to drive for a week. There’s an idea!
So my take on this is that, basically, NO ONE “pays their own share” on the road. Every form of transit is subsidized to some degree from general government funds. Bikes bikes require *less* of a subsidy than cars because they do so much less damage to the roads. Even walking is, arguably, subsidized by providing free sidewalks.
looks like we lowered our game on this one. http://knowyourmeme.com/photos/6512-facepalm
What is the budget breakdown for PBOT? Considering that most cyclists ride on city streets, and not ODOT highways. Why is the ODOT funding scheme important?
“People who ride pay about as much as those who always drive.”
They justify this statement by noting that “user fees” make up 78% of ODOT’s funding. User fees are registration fees, license fees, gas taxes, etc. But cyclists clearly pay less in gas tax. How much of that 78% is gas tax? Is it a significant portion? (Half of 78%? One quarter of 78%?) Why obfuscate the data like this? Until they provide a clear breakdown of each “user fee” I will remain highly skeptical of their conclusion. I want them to make the case, but they are providing a very incomplete picture with this graphic.
Sigma,
Well, of course, gas taxes are by far the largest component of “user fees”. So people who bicycle certainly pay less than those who drive all the time.
But they also you a radically smaller portion of the roadway. In most places it’s nearly zero, because they’re riding in a bike lane or over at the right edge of the rightmost lane. The majority of cars that pass do so in that same lane, so though they do presumably slow down and move over a bit to the left, there is still nearly the same auto capacity as would be if they were not present.
Now occasionally you’ll have a fast rider who occupies the center of the lane like a motorcyclist, but they’re rare.
And of course bicycles have no effect of decently built roads, so if everyone biked there’d be little to no need for maintenance.
So, the upshot is that the majority of bicyclists who also have a car but mostly use the bicycle are paying their fair share and then some just on the license and registration fees.
I have never really been a fan of the line of thinking that goes, “Most bicyclists are car owners too, so they pay their fair share,” and have tried several times to dissuade the BTA from using this argument. Doing that is trying to make a pro-bike argument by starting with an auto-centric framing, which is a strategy that’s bound to backfire.
I appreciate that the BTA is trying to push back against a persistent myth with a politically viable message, but transportation funding is sufficiently complicated that you really can’t give the issue proper treatment with an infographic. We like to say that transportation is a “derived demand,” which means that every trip has a certain reason for taking place, and an associated cost and (presumably) economic benefit. The BTA graphic talks a little about the cost of car trips, but doesn’t really talk about the tangible economic benefits (e.g., health outcomes, reduced congestion) of replacing those trips with bicycle trips. Freight trips are another big unturned stone. How much of user fees are generated by freight deliveries, which presumably I pay just as much of as car-owning consumers in the form of costs that are passed onto me at the register (or, in the case of Amazon shipments or pizza delivery fees, I pay them directly.).
It’s great that the BTA is tacking this, but there’s a certain amount of nuance to the issue that they’ll need to figure out how to address without diluting the potency of the message.
Yeah, one can argue that when they pay as car owners, they’re paying for their car use.
Also, I do think that, given the widespread obesity and other health issues, the potential need for less health care should be promoted (and I ague that bicyclists should get a 100% credit on any user fee because of that).
Bottom line, most bikers out there own cars. So for those driving cars by choice or necessity, this note: I can be in my car in front of you respecting the speed limit or on my bike beside you in the bike lane! Its a no brainer.
How about a “NO bike!” day when we all drive, walk, ride transit instead of biking and see how that works out for traffic in this uncongested burg.